


Month: October 2019

‘Targeted’ Rate Charts
Procurement of any commodity is an interplay of three key variables namely – Quality, Quantity and Rate. Coming to dairy procurement, where organizations usually follow a three-tier structure in India with aggregation of milk happening at the collection centre, then the chilling centre and finally at the plant level, the rate variable which farmers value most amongst all incentives, is leveraged to control the quality of milk and the quantity procured.
Organizations design rate-charts based on various aspects of milk such as Total Solids (TS), Fat/SNF, Protein etc:-. Various factors including the type of milk procured, the procurement geography, local competition, internal strategy and so on play a key role in determining the type of rate-chart to be espoused for the geography under consideration.
Once the rate-chart type is finalized, the next stage involves the assignment of rate. The following thumb rules are usually followed while designing the rate-charts:
- Setting the requisite min. TS or Fat/SNF below which milk wouldn’t be accepted. This is usually decided as per the FSSAI criteria set for the raw milk
- Rate per litre TS for a standard TS based on inputs such as the current or expected prices of final products mainly consisting of Skimmed Milk Powder (SMP) and Butter/Ghee
- Incremental incentivization of farmers based on quality so that farmers are encouraged not to use any adulterant especially water
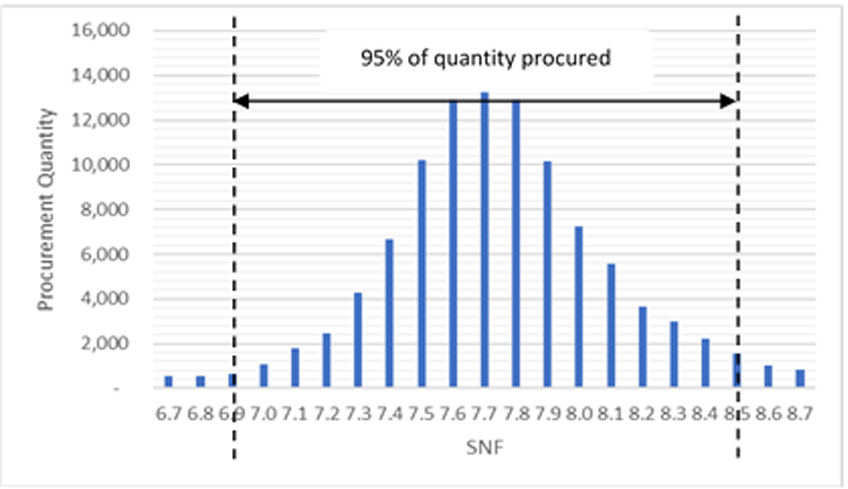
- Identification of max. SNF/Fat possible from the geography and keeping the rate constant beyond the same so that farmers don’t resort to any malpractices
In general, a separate rate-chart is prepared for all villages of a particular district or union. Also, typically a dairy company may go for increasing the rate-charts four times just before or during the lean season and decrease four times just before or during the flush season totalling an average of roughly eight times in a year.
Dairy companies have started becoming more efficient in their supply chain by using customized rate charts to the level of a village. This has been made possible with technological solutions such as ‘centralized rate-chart updation through cloud’. With this, a manager sitting at a remote location could readily act based on the local information that he/she gets from the internal or external sources by being able to update the rate-charts that is customized to a particular geography and that too without any limitation on the updation frequency. Further, thanks to technology, most of the usual analysis such as the total milk collected, weighted average SNF & Fat, avg. rate, total amount paid to each farmer, total TS in kgs etc:- are automated and dashboards summarising real-time data is accessible from any location via internet thus providing real-time insights for quick decision making.

Authored By
Kurian Uthuppu
Strategic Management Associate, Stellapps Technologies Pvt. Ltd.
Email: kurian.uthuppu@stellapps.com


